1.1.1 Medical Interventions Inventory
In this activity and following, we will act as medical professionals investigating an outbreak on a college campus. We investigated patient zero, Sue, and tracked how her mysterious infection spread across campus. Throughout the unit, other classmates and friends of Sue's, were added to the investigation. As medical professionals, we were tasked with analyzing patient symptoms, drawing connections, and DNA sequencing to diagnose the mystery infection. This activity will lead up to the research of various medical interventions, including antibiotic treatment.
In this activity and following, we will act as medical professionals investigating an outbreak on a college campus. We investigated patient zero, Sue, and tracked how her mysterious infection spread across campus. Throughout the unit, other classmates and friends of Sue's, were added to the investigation. As medical professionals, we were tasked with analyzing patient symptoms, drawing connections, and DNA sequencing to diagnose the mystery infection. This activity will lead up to the research of various medical interventions, including antibiotic treatment.
1.1.3 Using DNA to Identify Pathogens
In this activity, we worked to identify the mystery pathogen in Sue's DNA samples. First, we learned the process of DNA sequencing through the virtual lab, http://www.hhmi.org/biointeractive/bacterial-identification-virtual-lab . This lab demonstrated the six steps of sequencing (Sample Prep, PCR Amplification, PCR Purification, Sequencing Prep, DNA Sequencing, and Sequencing Analysis). After primers, DNA samples used for analysis, were isolated by the molecular biology department, the DNA analysis for Sue could be done. The lab returned the following DNA sequence from Sue's sample for our analysis:
atgacccgtc aatctctgca acaggctgcc gaaagccgcc gttccattta ttcgttaaat
aaaaatctgc ccgtcggcaa agatgaaatc gtccaaatcg tcgaacacgc cgttttgcac
acaccttctt cgttcaattc ccaatctgcc cgtgtggtcg tgctgtttgg cgaagagcat
This sequence of foreign DNA was then matched in the BLAST database, made available to us. BLAST is a national database with every known DNA sequence available. The process was simple: enter the foreign DNA sequence under nucleotide collection, similar sequences, and BLAST. Within minutes, the pathogen DNA present in Sue's sample was a 100% match to neisseria meningitidis, which appears in the human body as the infection, meningitis.

DNA Sequencing in the Virtual Lab, sequenced DNA of the foreign pathogen
|

DNA Sequence of neisseria meningitidis, 100% match of the BLAST database
|
1.1.4 What's the Concentration?
In this activity, we created an experiment to determine unknown concentration. We were given 300 mL of both a red and blue solutions with unknown concentrations (pictured below). Two additional flasks with 300 mL of distilled water were then gathered. In each flask, we added and tallied drops of red/ blue food coloring until the color matched the color of the flasks with unknown concentrations. To check our drops, we put the two flasks on a white piece of paper to compare the colors, corresponding with the concentration of drops to liters. From this experiment, we were able to infer that the blue concentration was approximately 7 drops/ liter and the red was approximately 10 drops/ liter.
Concentration is important when understanding the scale of infection in a patient. To best treat the patient, the concentration of infection must be discovered and matched to the concentration of treatment prescribed.
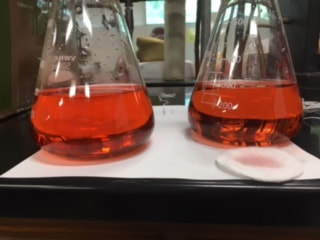
Red Concentration , original (left), matched concentration (right), 10 drops food coloring/ 1 L of water
|
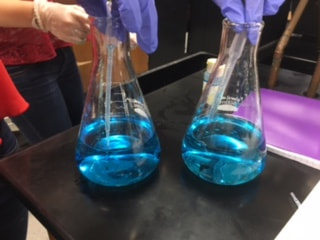
Blue concentration, original (left), matched concentration (right), 7 drops food coloring/ 1 L of water
|
1.1.5 ELISA
In this activity, we performed an ELISA (enzyme-linked immunosorbent assay). The ELISA was done to test the concentration of neisseria meningitidis antigen in the patient samples.
First, we assigned a set of standards to wells 2-12 and added 100 ul of antigen to well 1. After adding dilution buffer to each well, we transferred 50 ul to wells 2-12, via serial dilution. This allowed each well to have a different concentration of antigen, ranging from 1 ul/100 ml to almost nonexistent. Next, we labeled the experimental wells 13-24, with each three pairs having a different tester (50 ul Positive Control 13-15, 50 ul of Negative Control 16-18, 50 ul First Patient 19-21, and Second Patient 22-24).
After the wells were inverted and washed with a buffer, 50 ul of primary antibody was added to wells 1-24, washed, and 50 ul of secondary antibody was added. After another wash, the 50 ul of substrate was added to each well.
Finally, the wells were set for 5 minutes and observed. Based on our observation pictured below, we concluded that patient one was positive for neisseria meingitidis and patient two was negative.

Side-by-side comparison of set of standards (left) and experimental ELISA (right).
|

Comparing of ELISA samples.
|

|
1.1.6 Final Diagnosis
In this lesson, we were able to solve the mystery of the mysterious outbreak on campus. After DNA sequencing, we determined that Sue, Jill, Marco, and Maria were all infected with meningitis. Sue was patient zero and the infection was spread via direct contact with her. This infection can be treated with IV antibiotics. Meningitis is a common outbreak on college campuses as it is spread via direct contact. The other patients, Anthony and Arnie, were infected with Influenza B, as proven by their DNA sequencing. They were infected via direct contact with each other and can be treated with antiviral drugs. Maggie, while showing similar symptoms, was infected with Streptococcus (Strep throat). While it is highly contagious, she was the only one of the group to be infected and was treated with oral antibiotics. Wanda was infected with Herpes virus 4, which can be spread via bodily fluid, including saliva. She can be treated with over the counter medication. While Alvin refused DNA sampling, we can infer that he is at risk for Herpes virus after sharing a drink with Wanda. We recommend a return to the school infirmary. |

|
| 1.1.6_final_diagnosis.docx |
1.2.2 Which Antibiotic is the Best Choice?
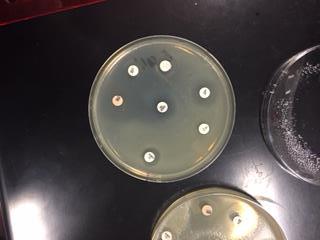
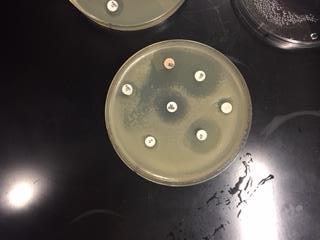
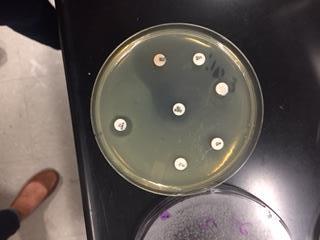
In this activity, we tested the effectiveness of seven different antibiotics on a Gram positive (B. cereus) and a Gram negative (E. coli) bacteria. We first gathered samples of both B. Cereus, a Gram positive bateria, and E.Coli, a Gram negative bacteria. On each sample, we used sterile technique to place sever different antibiotics on each plate. After 24 hours of incubation, we were able to observe the antibiotics zone of inhibition on each plate. These zones detected which antibiotics caused the bacteria to inhibit growth. In other words, the antibiotic was effective. After 48 hours of incubation, we were able to observe what antibiotics were truly effective in inhibiting growth of the bacteria samples.
The goal of this experiment was to determine which antibiotics were effective in inhibiting the growth of either Gram positive or Gram negative bacteria, or if they were effective in inhibiting both. This gave us a look on how antibiotics work to target specific bacteria.
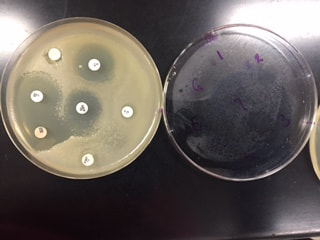
Day 2 - B. Cereus after 24 hours in incubation, zones of inhibition present.
Day 2 - E. coli after 24 hours in incubation, zones of inhibition present.
|
Day 3 - B. Cereus after 48 hours in incubation, zones of inhibition growth.
Day 3 - E.coli after 48 hours in incubation, zones of inhibition growth.
|

Labeled Bacterial Cell, with arrows showing what organelles are targeted by specific antibiotics.
1.2.3 Attack of the SuperBugs
In this activity, we explored the DNA transfer between bacteria cells and how the transfer of antibiotic resistant genes occurs. We first obtained four agar plates. One agar plate was left untouched, one was agar +streptomycin, one was agar + ampicillin, and the fourth was agar + streptomycin + ampicillin. Each plate was then divided into two sides. On one side, we streaked a sample of E Coli 1 streptomycin resistant and on the other side of the plate, we streaked a sample of E. Coli 2 ampicillin resistant. After 24 hours, we observed the growth (far left photo). The results showed that the resistant genes were able to grow in antibiotics presence. We then, obtained a strain from both agar plates and streaked a new, streptomycin and ampicillin resistant plate. After 24 hours, we were able to observe the growth of bacteria in antibiotic presence. This is evidence of a superbug bacteria, created in a lab setting.
The goal of this experiment was to address the growing public health concern of antibiotic resistant bacterial cells. Bacterial DNA transfer allows for these "superbugs" to be created, that are resistant to multiple antibiotics.

The four plates after 24 hours of incubation.
|

After 48 hours of incubation. Bacterial growth is present.
|

"Superbug" plate, resistant to both streptomycin and ampicillin antibiotics.
|
1.3.1 Good Vibrations
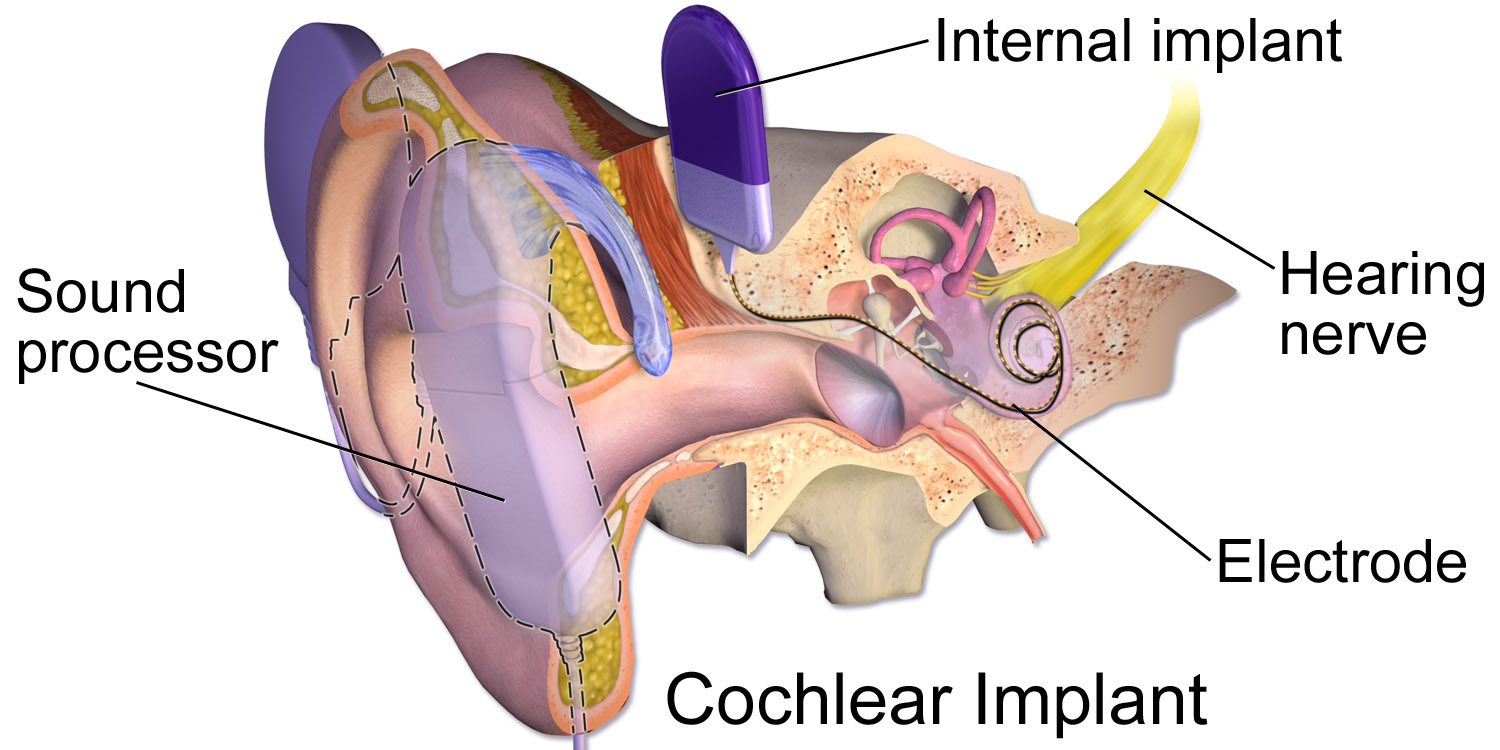
In this activity, we explored the fundamentals of sound, how it is produced, and travel from the outer ear to the brain. Sound travels by waves, taken in the outer ear, pinna, as a wave. The wave is broken down into frequency and amplitude. Frequency, the distance and occurrence of cycles in a wave, determines the pitch of sound. The closer together the cycles, the higher the pitch. Amplitude, the height of the wave, determines the volume of the sound, quiet to loud. The higher the wave, the louder the sound. Sound is detected by the pinna, the outer ear and travels through the middle bones and into the inner ear. As it travels, the wave is translated into a signal to the brain.
In this activity, we explored the fundamentals of sound, how it is produced, and travel from the outer ear to the brain. Sound travels by waves, taken in the outer ear, pinna, as a wave. The wave is broken down into frequency and amplitude. Frequency, the distance and occurrence of cycles in a wave, determines the pitch of sound. The closer together the cycles, the higher the pitch. Amplitude, the height of the wave, determines the volume of the sound, quiet to loud. The higher the wave, the louder the sound. Sound is detected by the pinna, the outer ear and travels through the middle bones and into the inner ear. As it travels, the wave is translated into a signal to the brain.

Labeled model of the ear.
1.3.2 Can You Hear Me Now?
In this activity, we ran a Rinne test, Speech-in-Noise test, and a Pure Tone test. The Rinne test tested the air and bone conduction of both ears. These measures indicate sensorineural and conductive hearing loss. If the bone conduction is evident for more time than the air conduction, conductive hearing loss is evident. Further testing, such as the Speech-in-Noise and the Pure Tone test can be done. The Speech-in-Noise test tests sensorineural hearing, listening under noisy background noise. Pure Tone tested the hearing in decibels of both ears and recorded them on an audio gram. The audio gram can be read to determine the normality or evidence of hearing loss in either ear.
In this activity, we ran a Rinne test, Speech-in-Noise test, and a Pure Tone test. The Rinne test tested the air and bone conduction of both ears. These measures indicate sensorineural and conductive hearing loss. If the bone conduction is evident for more time than the air conduction, conductive hearing loss is evident. Further testing, such as the Speech-in-Noise and the Pure Tone test can be done. The Speech-in-Noise test tests sensorineural hearing, listening under noisy background noise. Pure Tone tested the hearing in decibels of both ears and recorded them on an audio gram. The audio gram can be read to determine the normality or evidence of hearing loss in either ear.

Rinne testing- Air conduction, Right ear.
|

Normal audiogram, conducted by Pure Tone Test in class.
|
|
1.3.3 Cochlear Implant Debate
A cochlear implant is a hearing aid implanted into the cochlear organ. It contains both inner ear and outer ear components. Cochlear implants are controversial in both the medical and deaf community. Cochlear implants are specific to the individual and their hearing ability. This being said, the success rate is not 100% for every individual and could possibly further damage hearing. The deaf community views the implants as a divide between the healthy deaf and those with hearing disabilities, aka difficulty hearing and no sign language communication. |
|
|
1.4.1 Disease Prevention Through Vaccination
Top 10 Leading Causes of Death- 1900:
|
Top 10 Leading Causes of Death- 2000:
|
Disease trends from 1900’s to modern day have changed as diseases have been eradicated by vaccinations and proper healthcare. For example, in 1900, influenza was the leading cause of death. It is now the 9th or 10th cause of death in the US. This is because we have developed an effective vaccination that prevents the widespread of the flu virus. While flu is still a common virus, it is no longer a deadly virus as proper healthcare can treat the infection. Below is a disease card on Hepatitis A and the vaccine treatment for the disease.

Disease Card- Hepatitis A, prevalent disease in the United States
1.4.2 Vaccine Development
Recombinant DNA technology is the cutting, pasting, and recombining of two DNA sequences. The process is used for various purposes, including making vaccines. In the process, a donor DNA sequence and a host plasmid are cut on a specific DNA code via a restriction enzyme. This cut is then glued into the plasmid via ligase. Once the two sequences have been combined, they form recombinant DNA. Recombinant technology is used to make subunit vaccines. An example of a vaccine made by recombinant technology include Hepatitis B and Influenza.
Recombinant DNA technology is the cutting, pasting, and recombining of two DNA sequences. The process is used for various purposes, including making vaccines. In the process, a donor DNA sequence and a host plasmid are cut on a specific DNA code via a restriction enzyme. This cut is then glued into the plasmid via ligase. Once the two sequences have been combined, they form recombinant DNA. Recombinant technology is used to make subunit vaccines. An example of a vaccine made by recombinant technology include Hepatitis B and Influenza.
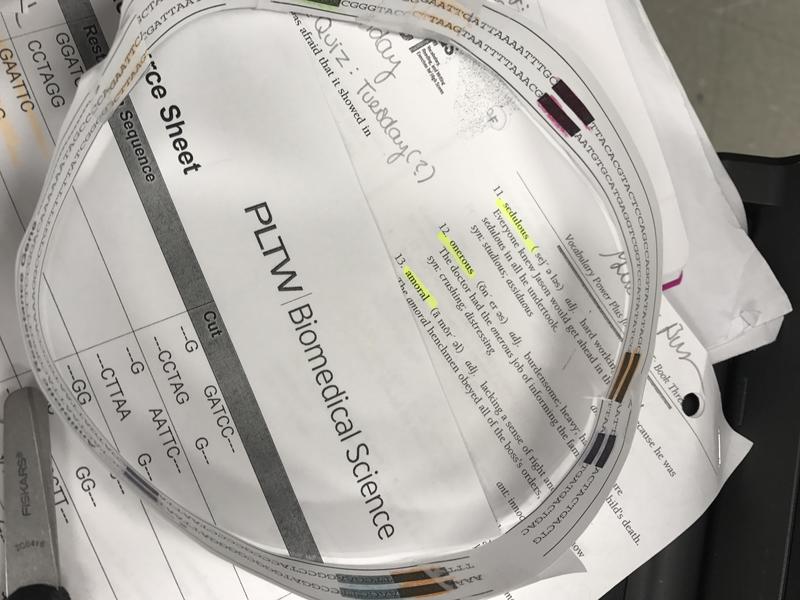
Plasmid created by using the restriction enzyme to cut sequence, GAATTC at -G and C-
|

Plasmid created by using the restriction enzyme to cut sequence, GAATTC at -G and C-
|
